Data Frame of Mind
A look into mining data with Ruby!

January 2, 2020
Here at Brand New Box, storing and manipulating data is imperative. Sometimes our clients want to see patterns in their applications data. Things like: how much traffic their site gets in a day, the number of customers ordering a certain product in a certain time frame or the average age of their users. This information and much more can be found through the use of data mining.
I’m going to explain a recent data mining project of mine from university and how my experience at Brand New Box helped me tackle it. The project: Implement a data analytics algorithm using data mining techniques.
Data mining is a method of discovering information and patterns in large data sets through machine learning and statistics.
Using data mining techniques, the project needed to generate a rule set for a data set like this:
| Temperature | Cough | Sneeze | Flu | |
|---|---|---|---|---|
| 1 | normal | no | no | very-unlikely |
| 2 | hot | somewhat | somewhat | likely |
| 3 | normal | somewhat | no | unlikely |
| 4 | hot | somewhat | somewhat | likely |
| 5 | normal | no | yes | very-unlikely |
| 6 | hot | yes | somewhat | likely |
| 7 | hot | yes | yes | highly-likely |
| 8 | normal | yes | yes | highly-likely |
English Please.
This doesn’t make a lot of sense? Let me explain.
A valid rule is made up of one or more attribute values and a decision value that complies with the dataset. A rule set is a list of those rules and it gives us insight into underlying data patterns.
Each row of the data set is referred to as a case and each column is an attribute tied to that case. The last column, however, is the decision value. Translated to English: case 1 tells us, among other things, that with a normal temperature and no coughing or sneezing symptoms, you're very-unlikely to contract the flu.
Keep in mind we are looking for patterns here.
Generating Rules!
Lets start with the first decision value. We want to know what symptoms are needed to reach a decision value of Flu = very-unlikely. Well, assuming the data set is consistent, we might need all three Temperature, Cough and Sneeze values to reach the decision very-unlikely. Looking at the first case and its attributes, lets say it is our first rule:
(Temperature, normal) & (Cough, no) & (Sneeze, no) -> (Flu, very-unlikely)This rule is valid, but it is also very specific. If we try removing an attribute, we may attain a broader rule to potentially cover more cases. Currently this rule covers the first case only. Let’s see what happens if we remove Sneeze:
(Temperature, normal) & (Cough, no) -> (Flu, very-unlikely)Woah! Looking at the data set, we can see that this goal now covers both Flu, very-unlikely cases (1 and 5) properly! If we tried removing another attribute (either Temperature or Cough ) we would receive an invalid rule. We’ll keep this rule as is and add it to our rule set. This process will be repeated for the other decision values till all cases are “covered” and we end with a rule set like this:
(2, 2, 5)
(Temperature, normal) & (Cough, no) -> (Flu, very-unlikely)
(2, 1, 4)
(Temperature, hot) & (Sneeze, somewhat) -> (Flu, likely)
(1, 3, 6)
(Temperature, normal) & (Cough, somewhat) -> (Flu, unlikely)
(2, 2, 3)
(Cough, yes) & (Sneeze, yes) -> (Flu, highly-likely)
The three numbers above the rule simply point out the strength, relevancy and number of cases covered by the rule below it. These numbers are important in data analytics as they help us understand which patterns occur more often than others.
This rule set could be most useful for medical practitioners. Practitioners can use the patient symptom data to find patterns for accurate patient diagnosing.
Note that this particular data set only has 8 cases. The project needed to be capable of creating rule sets for data files consisting over 1000 cases!
Implementation
Ok, now that we are data mining geniuses, we'll explore the thought process for the actual coding. Initially, I chose to use two-dimensional arrays to store and manipulate the data. This would work just fine, if all I needed to do was perform the same tasks repeatedly on all columns of the data set.
However, in order to compute rules properly, we would need to target specific columns by attribute name and dynamically create columns throughout the execution of the program in order to update the state of each generated rule.
Two-dimensional arrays out the window!
What's a two-dimensional array? Imagine an excel document: think of a two-dimensional array as a 8x8 excel grid without the A, B or C column labels. Instead of letters, each column is identified by a number. For this implementation we need to identify columns by attribute names like Sneeze or Cough. Identifying them by column 1 or column 2 wouldn't help.
After realizing arrays would only cause more headaches than help, I pivoted to using a simply data analytics gem through Ruby. Gems are importable Ruby libraries that give developers abstracted ways of using Ruby. Here at Brand New Box, gems allow us to build SWEET features for our applications.
I choose you Daru!
The Daru gem, with its sharp analytical tools and dynamic table-like data structure, was exactly what I needed.
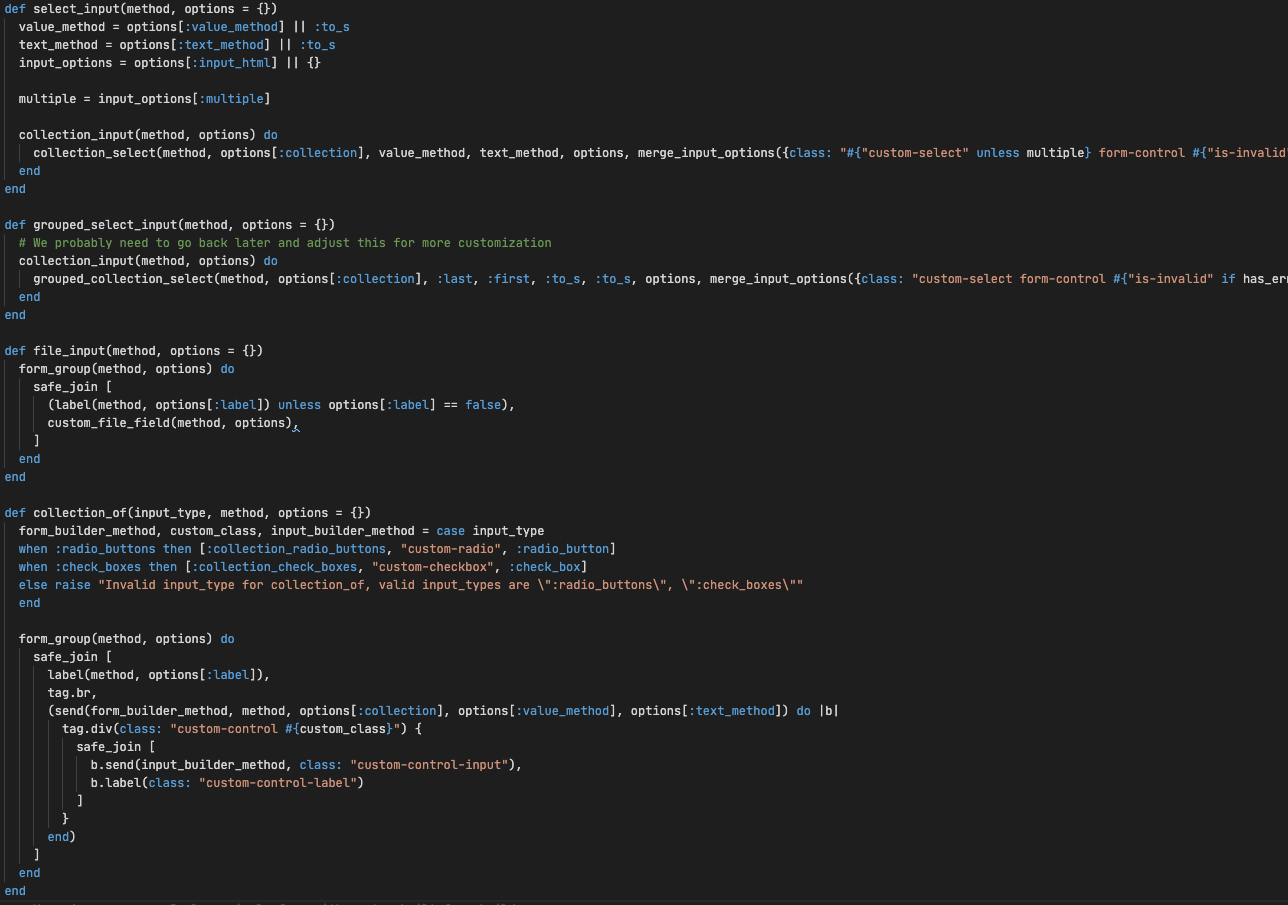
def create_data_frame(arr)
  @df = Daru::DataFrame.new(arr)
  attributes_and_decision_name = Daru::Index.new(@df.row[0].map { |x| x.to_sym })
  @df.vectors = attributes_and_decision_name
endDaru (Data Analysis in RUby) is a Ruby library leveraging data frames for analyzing, manipulating and visualizating data.
With data frames, we can label each column with unique identifiers, generate new columns with manipulated data and visualize underlying data set patterns. Generating the data frame was simple, manipulating the data was straightforward and visualizing the outcome was rewarding.
#
    attribute_value         cases           num_of_cases     [1, 5]      [1, 5]      [2, 4, 6]      [2, 4, 6]      [3]      [3]      [7, 8]      [7, 8]
  0 (Temperature, normal)   [1, 3, 5, 8]    4                [1, 5]*                 []             []             [3]*              [8]         [8]
  1 (Temperature, hot)      [2, 4, 6, 7]    4                []          []          [2, 4, 6]*                    []       []       [7]         [7]
  2 (Cough, no)             [1, 5, 6]       3                [1, 5]      [1, 5]*     [6]            [6]            []       []       []          []
  3 (Cough, somewhat)       [2, 3, 4]       3                []          []          [2, 4]         [2, 4]         [3]      [3]*     []          []
  4 (Cough, yes)            [6, 7, 8]       3                []          []          []             []             []       []       [7, 8]*
  5 (Sneeze, no)            [1, 3]          2                [1]         [1]         []             []             [3]      [3]      []          []
  6 (Sneeze, somewhat)      [2, 4, 6]       3                []          []          [2, 4, 6]      [2, 4, 6]*     []       []       []          []
  7 (Sneeze, yes)           [5, 7, 8]       3                [5]         [5]         []             []             []       []       [7, 8]      [7, 8]*
Note:
the last few columns (
[1,5], [2,4,6], [3], [7,8]
) represent decision value outcomes. For example,
[1,5]
refers to cases 1 and 5 which have a
(Flu, very-unlikely)
decision. The
*
symbol marks a particular decision's attribute values that will be used for creating a rule for said decision.
Using this data frame, I was able to generate the rule set from above.
Conclusion
This project was a small look into the practice of data mining through Ruby.
Ruby provided simple syntax and the Daru data frames gave a straightforward approach to finding a rule set using data mining techniques.
Storing data is crucial, but understanding data is eye-opening. While the amount of data consumption increases, so will the influence of data mining procedures. From science to finance to education, understanding patterns in our data allows us to see the world in a newer, more complete way!